
Diagram: Bias in Machine Learning
Understand the stages of machine learning where bias can, and often will, contribute to harm.
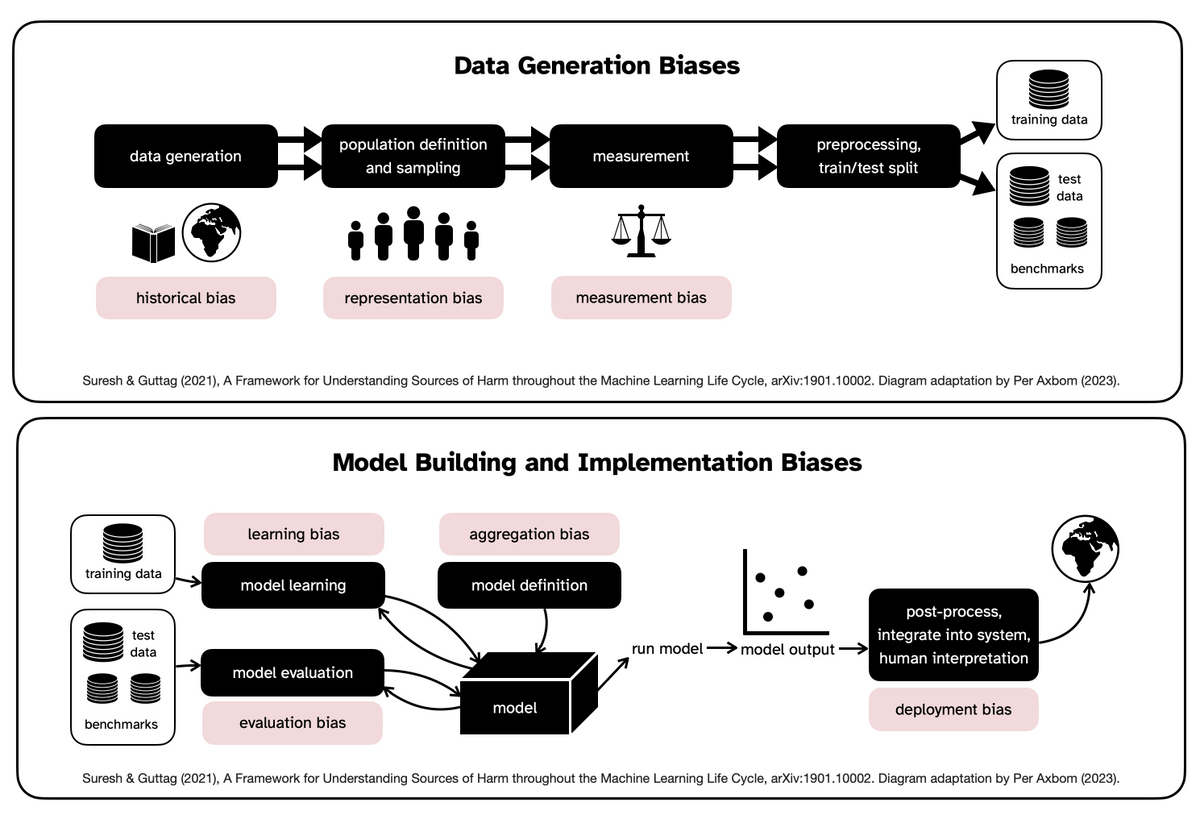
In July I got a tip from Gino Almondo introducing me to the paper A Framework for Understanding Sources of Harm throughout the Machine Learning Life Cycle (Suresh & Guttag, 2021). It contains a very useful diagram outlining where and how bias will affect the outcome of the machine learning process. I could not help but apply my own visual interpretation to it for use in teaching. Feel free to use it to understand why and how so-called AI tools can, and often will, contribute to harm.
I contacted the authors, Harini Suresh and John Guttag, and have their approval for my reimagination of their chart. For an in-depth understanding of the different biases I recommend diving into their paper. The following is a brief overview of what the diagram addresses.
Overview of bias in machine learning
No system is stronger than its weakest link. Suresh & Guttag explain where the weak links in machine learning are, looking at both the data generation process and the process for model building and implementation.
a) Data Generation
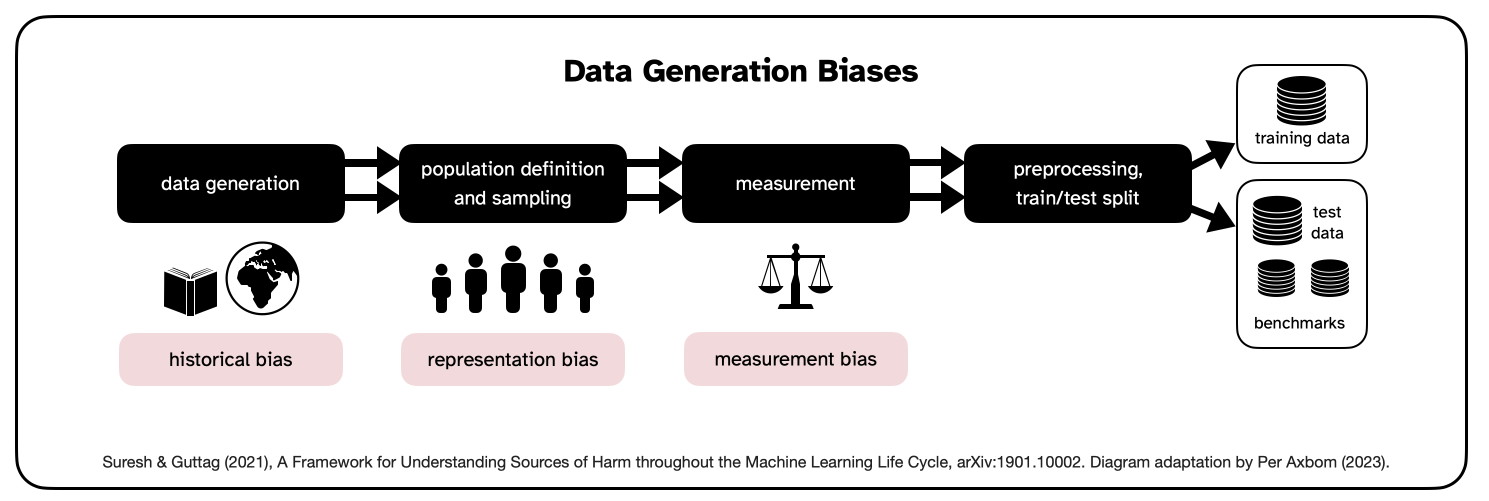
The points of bias are:
- Historical bias. Harmful outcomes arise when people are mistreated because of prejudice contained within the dataset. Note that harm can and will happen even if the data represents an accurate representation of the world. This is because real-world prejudice, both current and historical, becomes embedded in software that works faster (essentially accelerating the bias), reaches further and is harder to call out and object to.
- Representation bias. When data fails to represent significant parts of the population it may fail to generalize well for the population that it is being used by or for. The target population in the dataset may not represent the use population or may contain underrepresented groups – where there is less data to learn from. The sampling method may also be limited or uneven (example: less available health data for an uncommon condition, or rarely researched condition, will lead to poorer performance for that condition).
- Measurement bias. When used for prediction and understanding, models need the selection, collection and computing of features and labels to draw conclusions from. These labels may be an oversimplification, or the method/accuracy can vary across groups, (example: creditworthiness based on credit score, or crime rates being high because there happens to be more law enforcement presence in the area - leading to more discoverability and more presence, or pain assessment varying across groups).
b) Model Building and Implementation
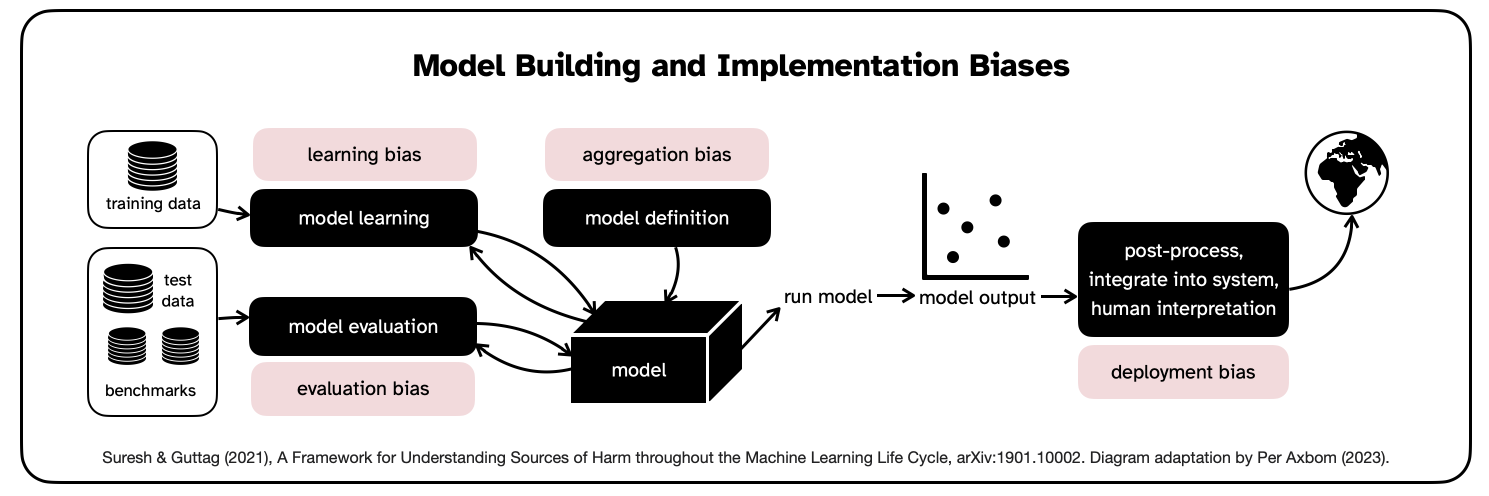
The points of bias are:
- Evaluation bias. A model is optimized on its training data, but its quality is often measured on benchmarks. Hence, a misrepresentative benchmark encourages the development and deployment of models that perform well only on the subset of the data represented by the benchmark data. The benchmark can itself suffer from historical, representation or measurement bias. (example: Images of dark-skinned women comprise only 7.4% and 4.4% of common benchmark datasets Adience and IJB-A, and thus benchmarking on them fails to discover and penalize underperformance on this part of the population. [Buolamwini and Gebru, 2018])
- Learning bias. Differences in performance occurs for different types of data because of modeling decisions made to influence for example accuracy or objectivity. These decisions can erode the influence of underrepresented data, and subsequently the models perform even worse on that data.
- Aggregation bias. A particular dataset might represent people or groups with different backgrounds, cultures or norms, and any given variable can indicate different things across these groups. A one-size-fits-all model may fail to optimise for any group, or only fit the dominant population (example: models used in hiring processes for sentiment analysis may fail to consider differences in facial expression that can relate to culture or certain disabilities).
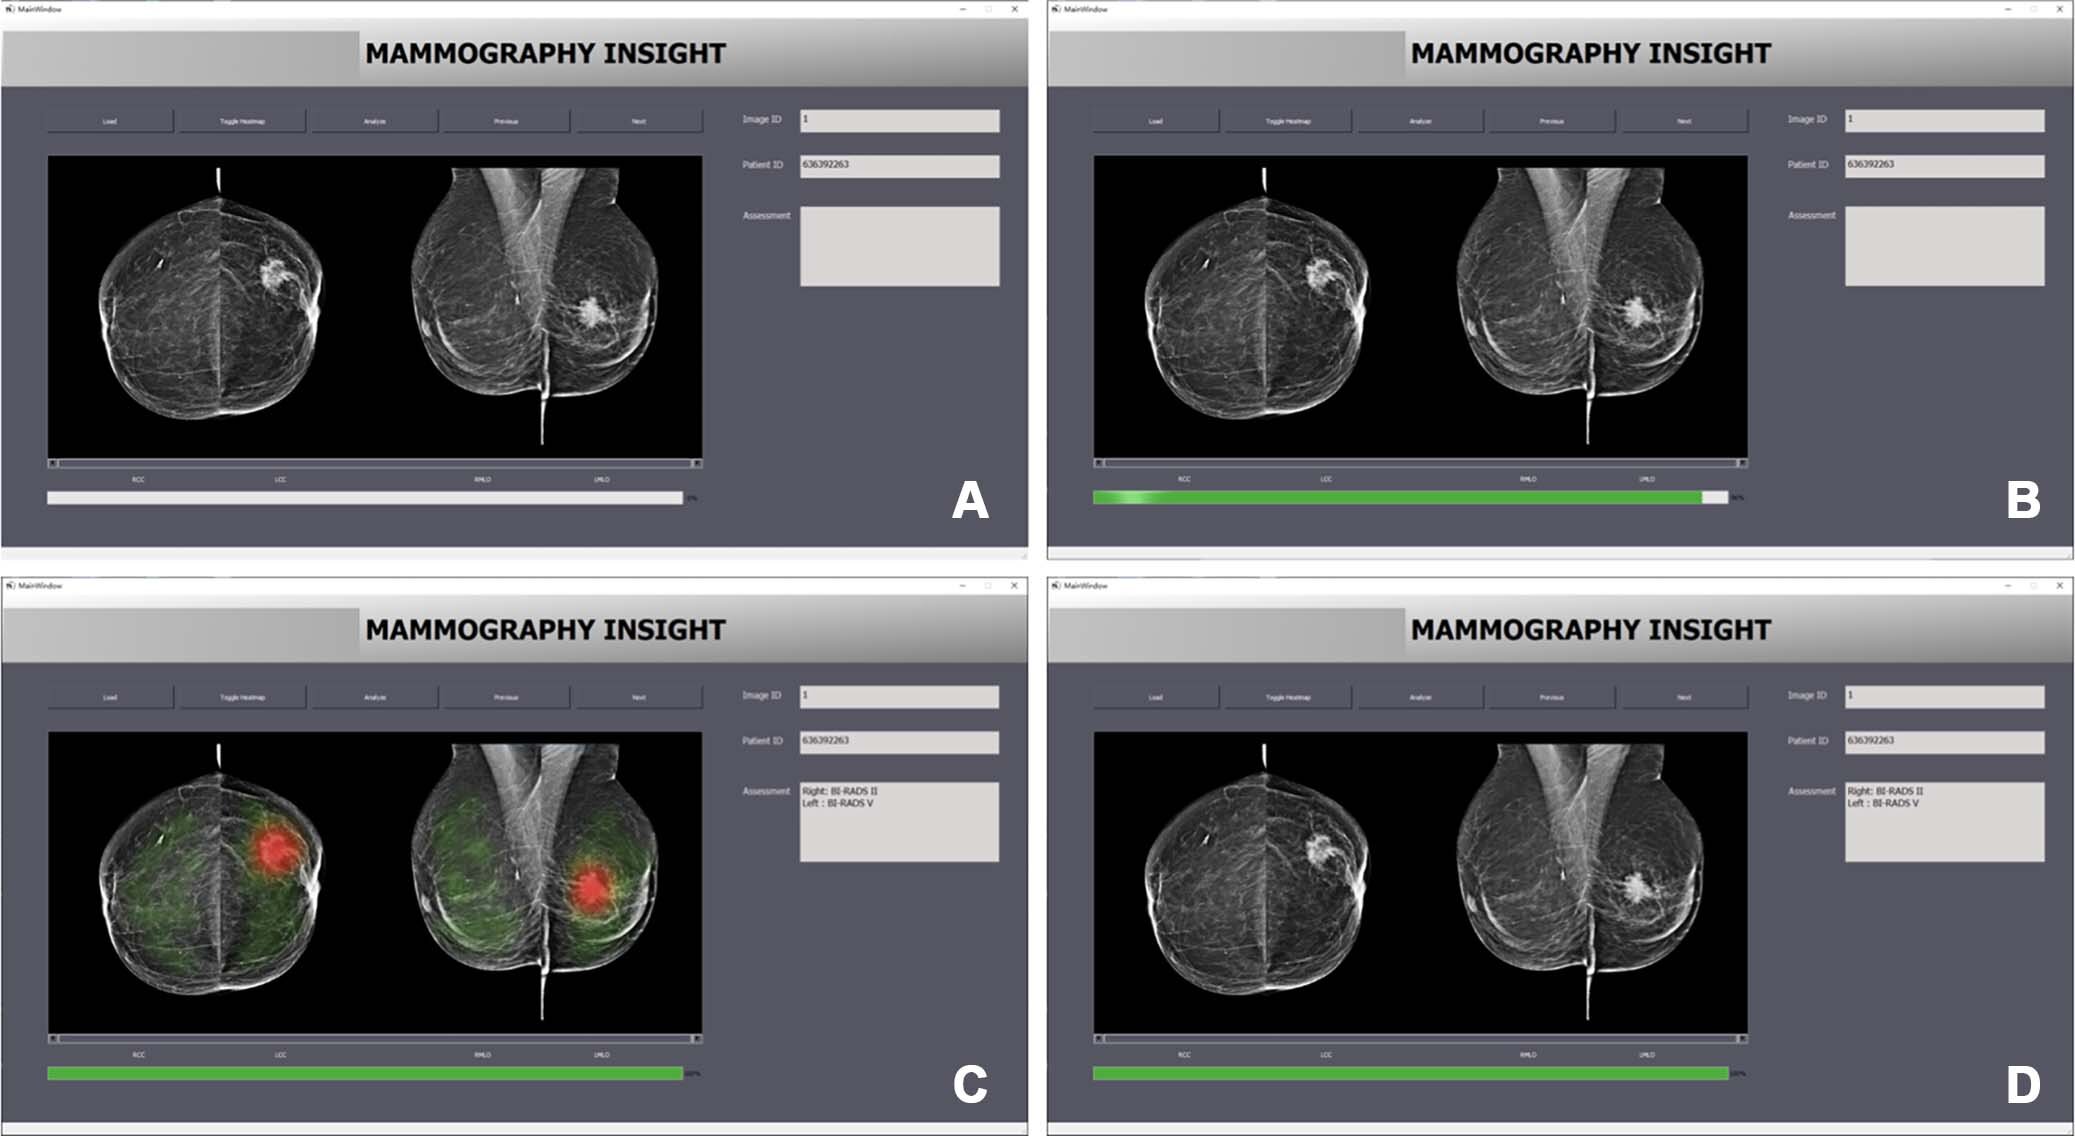
- Deployment bias. Some models may actually be used in ways they were not intended to be used. As Guttag & Suresh write: "This often occurs when a system is built and evaluated as if it were fully autonomous, while in reality, it operates in a complicated sociotechnical system moderated by institutional structures and human decision-makers." This is also known as the "framing trap" (Selbst et al., 2019). These tools can lead to harm because of automation or confirmation bias (example: Incorrect advice by an AI-based decision support system could impair the performance of radiologists when reading mammograms).
How to use the diagram
When building, considering and evaluating systems based on machine learning, part of your responsibility is to understand the ways in which the tool can contribute to harm. Be transparent about these issues and how real, resolute work is required for the issues to be uncovered and managed. Sometimes the answer will be that a tool based on machine learning is not the right tool for the job.
References and Further Reading


Comment